0800 808 280 · info@cdp.co.nz
  • Privacy Policy
  • Contact
  • Support
CDP CDP CDP CDP
  • Home
  • Services
    • Data integration & engineering
    • Dashboards & visualisation
    • Planning & forecasting
    • Mentoring & training
    • Performance Plan for Analytics
    • Rapid Analytics & Planning Modules (RAM)
  • Customer Stories
  • Blog
  • Our Team
CDP CDP
  • Home
  • Services
    • Data integration & engineering
    • Dashboards & visualisation
    • Planning & forecasting
    • Mentoring & training
    • Performance Plan for Analytics
    • Rapid Analytics & Planning Modules (RAM)
  • Customer Stories
  • Blog
  • Our Team
May 04

The difference between a dashboard and a scorecard?

  • 04/05/2011
  • Craig Catley
  • No Comments
  • Business Intelligence, Dashboards & Visualisation

These terms are often used interchangeably, which can cause confusion. There is no rule about what each term means, but I like to make a distinction between the two to remove that confusion. The following diagram summarises what I see as the essential differences between the two:
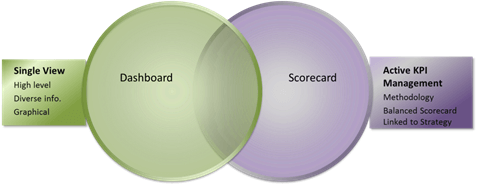
Dashboard vs Scorecard

Dashboards

Dashboards typically attempt to provide management with high level information about different parts of the business, in one view. This view may be:

  • One IBM Cognos Report Studio report, with multiple objects displayed
  • An IBM Cognos dashboard with dynamic content – Report Studio objects, conditional formatting, drilling through to more detailed reports

Scorecards

typically provide management with metrics that they need to actively manage because they are important to the business. They assist management by:

  • Showing what parts of the business drive the KPIs
  • Show the progress over time and make a prediction about what will happen if changes are not made
  • Identify at what level of the business, the changes need to be made
  • Always have targets/budgets
  • Scorecards are typically based on a methodology and linked to the organisation’s strategy. The most famous example of this is Robert Kaplan and David Norton’s Balanced Scorecard. It attempts to balance the four main factors that drive a business (finance, human resources, operations and customers), without giving undue emphasis to components that are easier to measure, such as finance
  • IBM Cognos’ Metrics Studio is designed with this type of scorecard in mind

The overlap:

  • The dashboard might be the highest level of the scorecard
  • Some dashboards are dynamic, all scorecards should be
  • Facebook
  • Twitter
  • LinkedIn
  • E-Mail

Leave a reply Cancel reply

Your email address will not be published. Required fields are marked *

CDP BLOG

We are specialist consultants for analytics, planning & data integration in New Zealand. This blog provides an open platform for discussion.

Categories

  • Budgeting & Forecasting
  • Business Analytics
  • Business Intelligence
  • Dashboards & Visualisation
  • Data Integration
  • Data Warehousing
  • Performance Management
  • Planning & Forecasting
  • Uncategorised

Recent Posts

  • CDP Helps Major New Zealand Retailer Assess the Impact of COVID-19
  • IBM’s new Cognos Analytics 11.1 with infused Watson Analytics capability
  • Is your Data Warehouse Crawling or Running?
CDP Logo
© Copyright CDP Group Limited Specialist consultants for analytics, planning & data integration.

IBM-partner-logo
  • Home
  • Customer Stories
  • Our Team
  • Blog
  • Data integration & engineering
  • Dashboards & visualisation
  • Planning & forecasting
  • Mentoring & training
  • Performance Plan for Analytics

Search the site

Contact us