Increased Dashboard Functionality
With new and updated functionality around filters, calculations and visualisations this is the most exciting release of Cognos Analytics. Here are a few of the updates:
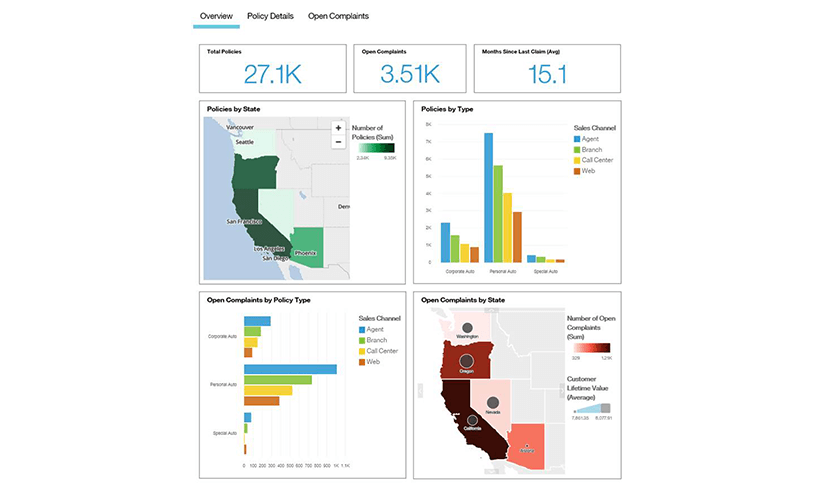
- Enhanced Filtering – the addition of the Filter dock area at the top of the Dashboard allows users to declutter their dashboards, filters can be applied to either the current tab or the entire dashboard.
- Calculations – in addition to the basic calculations we are used to the new Calculation expression editor allows you to type in the expression you want. When creating a simple calculation users will have the ability to include a constant rather than having to always reference a data field. Embedded or Local calculations can be added in the data tray for occasions when you need to evaluate the raw data rather than summarised data.
- Top and Bottom filtering is no longer restricted to a basic selection of 5 or 10, you can enter the number of records you wish to focus on.
- Updated Visualization Expand mode – the data slots have been moved to the left of the visualization meaning a shorter drag and drop path to add data. Mandatory data slots are now marked with a red asterisk showing what must be filled before the chart will render.
- Navigations Paths (Hierarchies) – these can now be created on the dashboard rather than having to create them in a Data Module.
- Multiple columns per slot – think nesting, this is the ability to add multiple data categories in the same axis.
- Measures can be categories – Multiple measures can be added to the Measure slot creating a Measure group which can then be moved to other areas of the visualization.
- Repeating Slots – similar to a Chart Matrix this will allow users to declutter a single chart and split it into multiple charts.
- New Visualizations – Added to the existing catalogue is the Network Visualization and the Stacked 100% Bar, while the Radial and Radial Bar have been merged into one visualization. The Grid has been renamed to Table and the Hierarchy has been renamed to List.
- As well as updating the Portal look and feel Dashboards has had an update with all new icons and colours giving it a clear, precise and professions look. The combining of the Media, Text and Shapes widgets sections into a new single section called Widgets reduces the number of clicks to find what you need to add to your dashboard.
- And finally the ability to now stretch the source panel means no more truncated names.
Updated Look and Feel for the Portal and Dashboards
The portal interface has been refined and updated in an effort to improve the customer experience as well as line-up with the experience and technology of Watson Analytics.
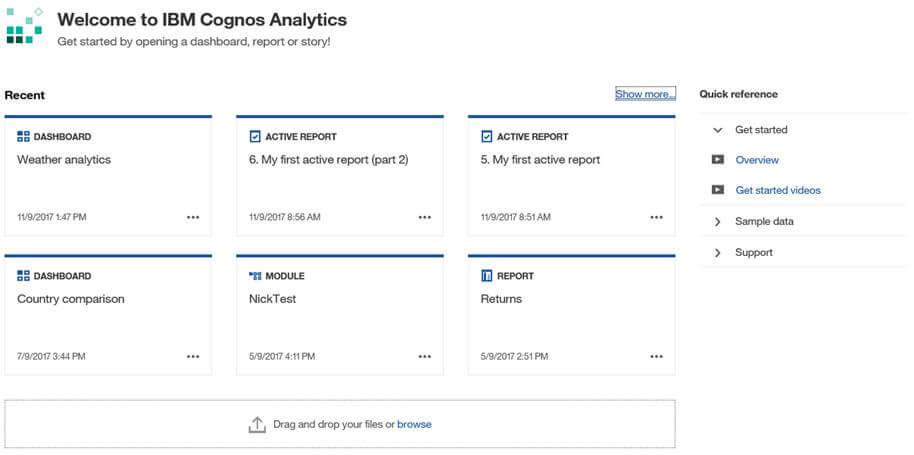
The Welcome screen has had a major overhaul with your most recently used items appearing as tiles, much like they do in Watson Analytics, allowing for quick access and recall. To provide a more self-supportive environment, Quick Reference Links have been added to provide instant access to getting started videos, sample data and communities. The welcome screen can still be modified to suit your corporate needs
A simplified content navigation pane means that rather than having to choose between two views the capabilities have been integrated into a single view which allows you to resize the pane, use the bread crumbs for navigation and sort the items in ascending or descending order by name or date.
Uploaded files has been integrated into the New menu or can simply be dropped onto the welcome screen, and Notifications have been moved to the bell icon in the top right corner of the screen.
Maps and Navigation Paths Added to Reports
Mapbox maps can now be included in regular reports and not just in Dashboards. Reports will support map resolutions down to the postal code level and because the maps are interactive, users can zoom in/out directly on the maps without going back to the report server to re-render the entire report. Tooltips are available for both layers to display measures associated to a location.
Navigation paths, which were previously only available in Dashboards, can be accessed and utilised on reports allowing users to explore their data in a new and exciting way.
Increased Functionality for Report Consumers
The on demand toolbar give report consumers the ability to understand the context of a report without relying on the report authors, it allows users to create filters, simple calculations, sorting and much more directly on the report output.
The new Filter Panel added in this release will help report users to manage all filters applied to a report interactively. This also helps users to better understand the report context and modify views accordingly. Report authors will be able to decide if they want to make an authored filter visible for report consumers to interact with in this filter panel.
Support for PowerPlay Added
PowerPlay Studio can be launched from the legacy application area within Cognos Analytics, and all of your PowerPlay reports and report views can be executed and managed from within the Cognos Analytics portal.
New versions of PowerPlay Enterprise Server, PowerPlay Windows client and Transformer have been released.
PowerPlay Windows client and Transformer now officially support Windows 10 and PowerPlay Studio supports Chrome (59.0.3071.104), Firefox (54.0) and Internet Explorer (11).